Regional Tensions Severely Disrupt Flight Activity Across the Gulf
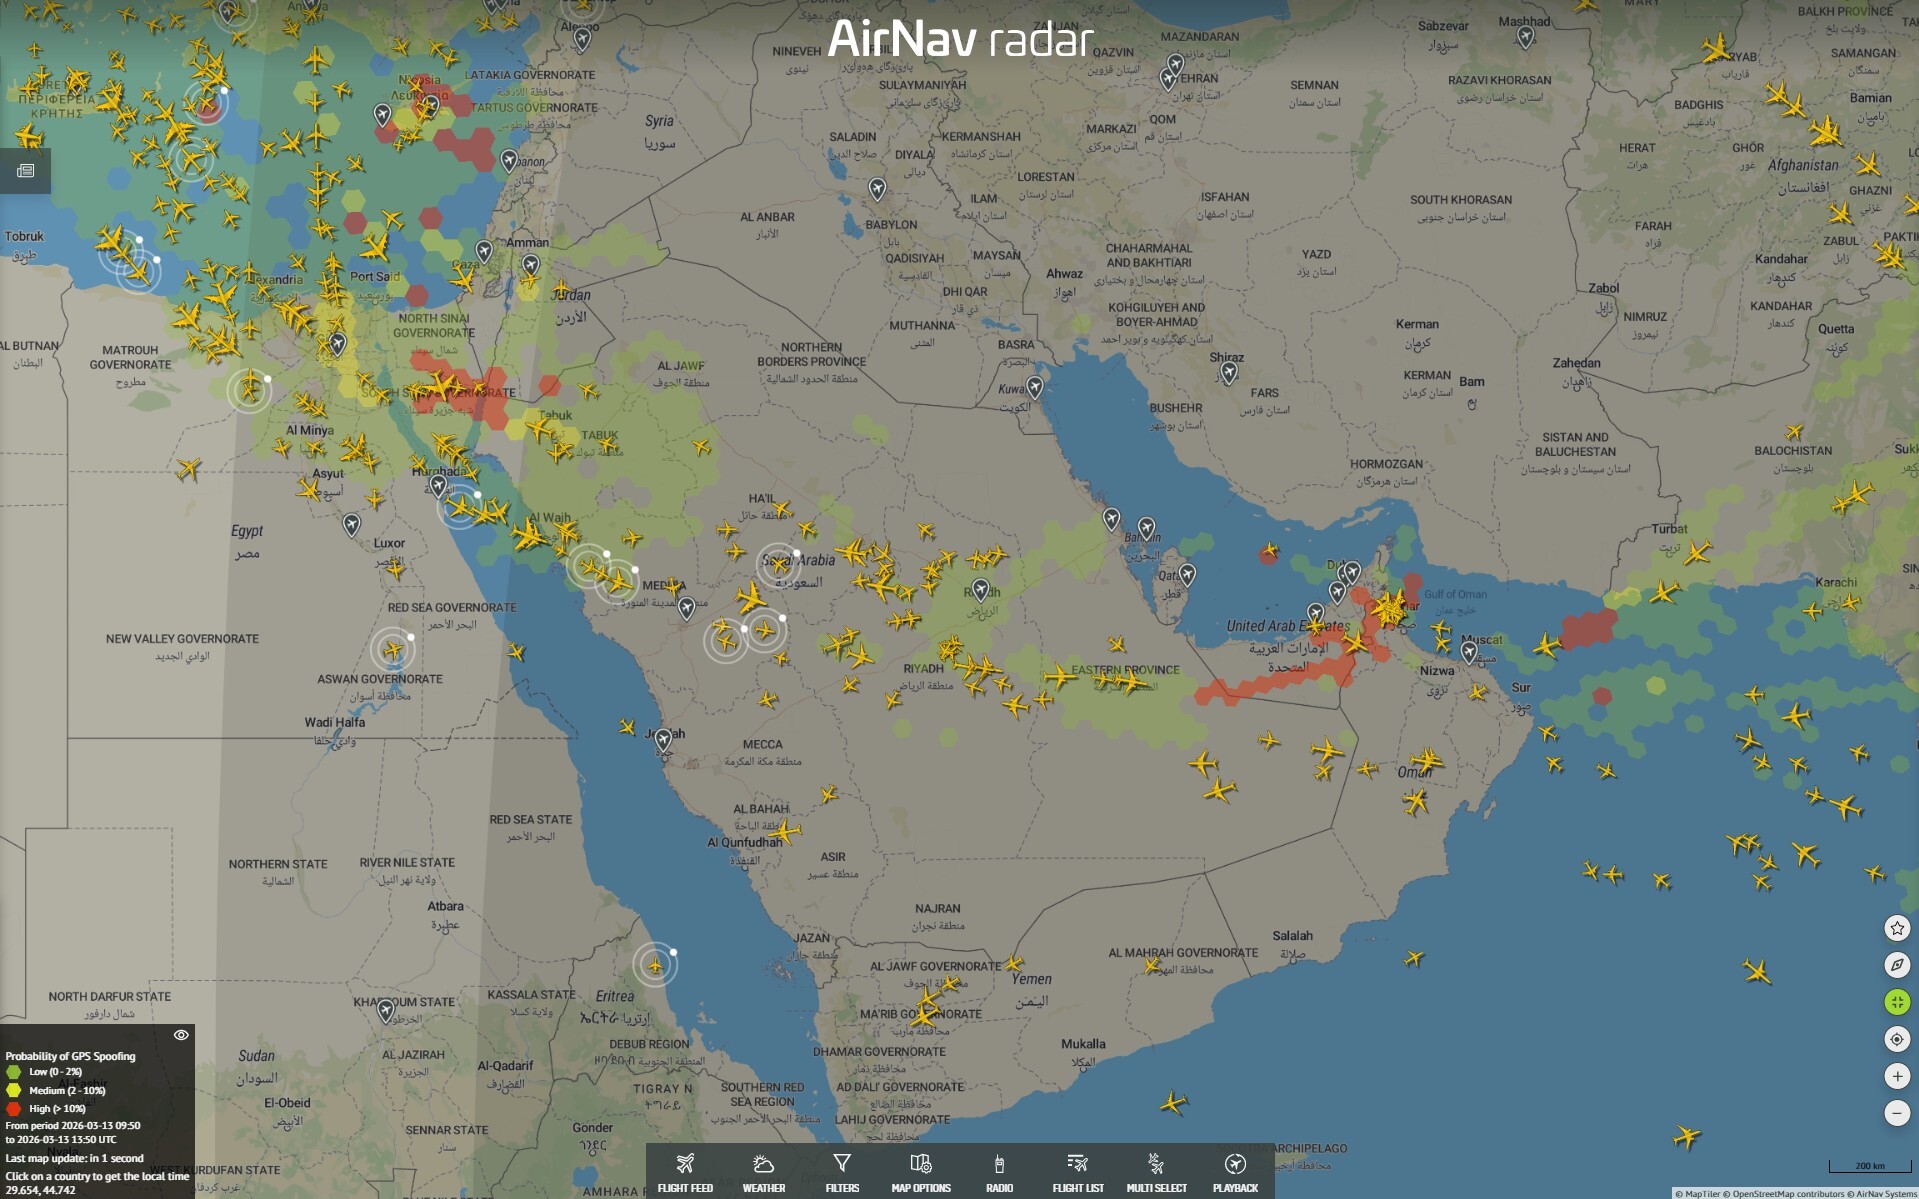
The recent escalation involving Iran, Israel, and the United States triggered one of the sharpest short-term aviation disruptions ever recorded across the Gulf region.
Airspace restrictions, safety concerns, and rapid operational adjustments forced airlines to suspend or reroute large portions of their networks. Data from AirNav Radar shows how dramatically the crisis impacted major hubs and airlines across the Middle East.
From Dubai to Doha, flight activity collapsed by more than 90% at the peak of the disruption, highlighting how quickly geopolitical conflict can ripple through global aviation.
Dubai: One of the World’s Busiest Hubs Nearly Stops
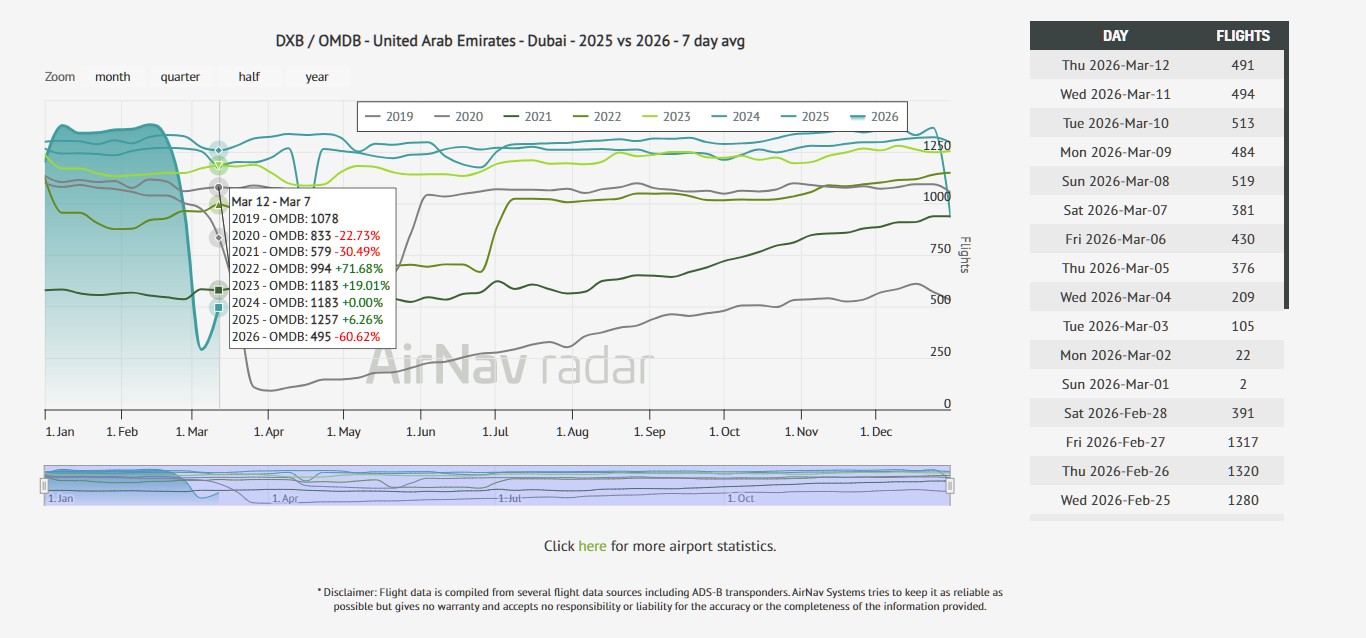
Operations at Dubai International Airport (DXB) experienced an unprecedented drop. Normally handling around 1,200 flights per day, the airport saw traffic collapse during the peak of the crisis:
-
Mar 1: 2 flights
-
Mar 2: 22 flights
-
Mar 3: 105 flights
-
Mar 4: 209 flights
Even by March 12, activity had only recovered to ~491 flights, still far below normal levels.
For one of the world’s most important global hubs connecting Europe, Asia, Africa, and Oceania, the disruption represented a major shock to international aviation flows.
Abu Dhabi Also Saw a Major Operational Collapse
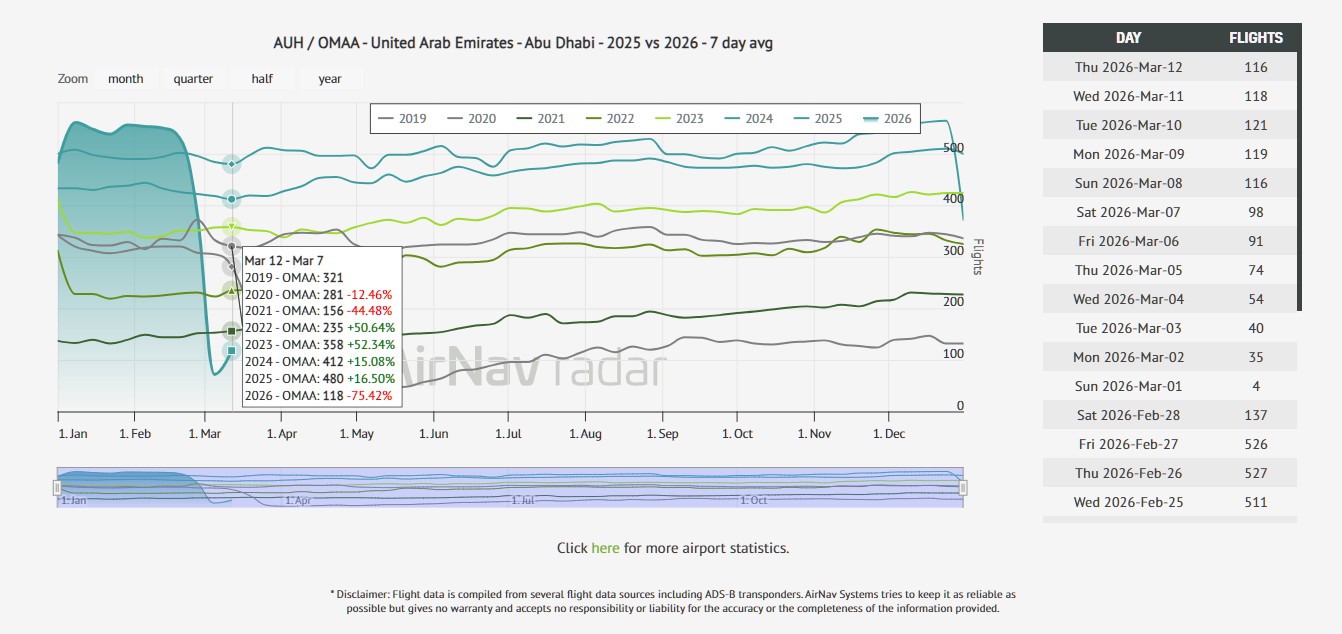
The disruption quickly spread to Zayed International Airport (AUH), the main hub for Etihad Airways. Typical activity at the airport averages around 500 flights per day. During the peak disruption:
-
Mar 1: 4 flights
-
Mar 2: 35 flights
-
Mar 3: 40 flights
-
Mar 4: 54 flights
By March 12, operations had only recovered to 116 flights, still significantly below normal levels.
Doha: Traffic Collapsed at One of the Middle East’s Largest Hubs
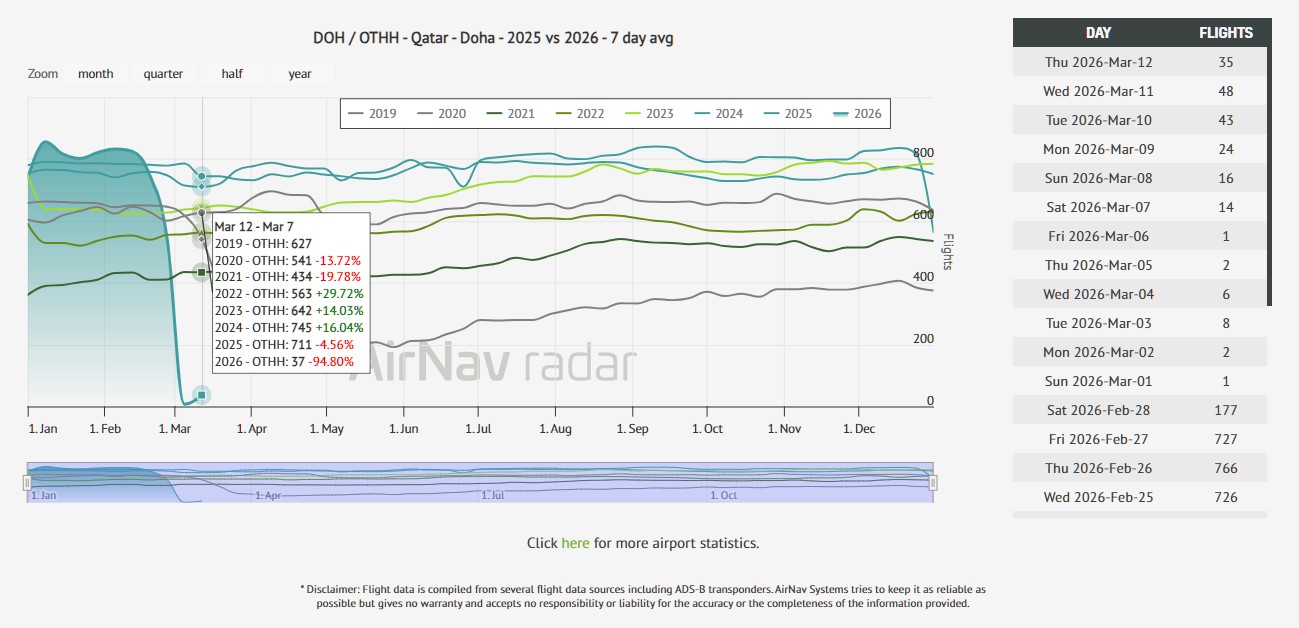
The crisis also had a dramatic impact on Hamad International Airport (DOH) in Doha, the global hub for Qatar Airways. Normally handling 700–750 flights per day, the airport experienced a near-complete halt in activity:
-
Mar 1: 1 flight
-
Mar 2: 2 flights
-
Mar 3: 8 flights
-
Mar 4: 6 flights
Even by March 12, only 35 flights were recorded.
At the peak of the disruption, this represents a greater than 90% collapse in daily traffic.
Airline Operations Were Also Severely Impacted
The regional disruption quickly spread from airports to airline operations, particularly for carriers whose networks rely heavily on Gulf hubs.
Emirates
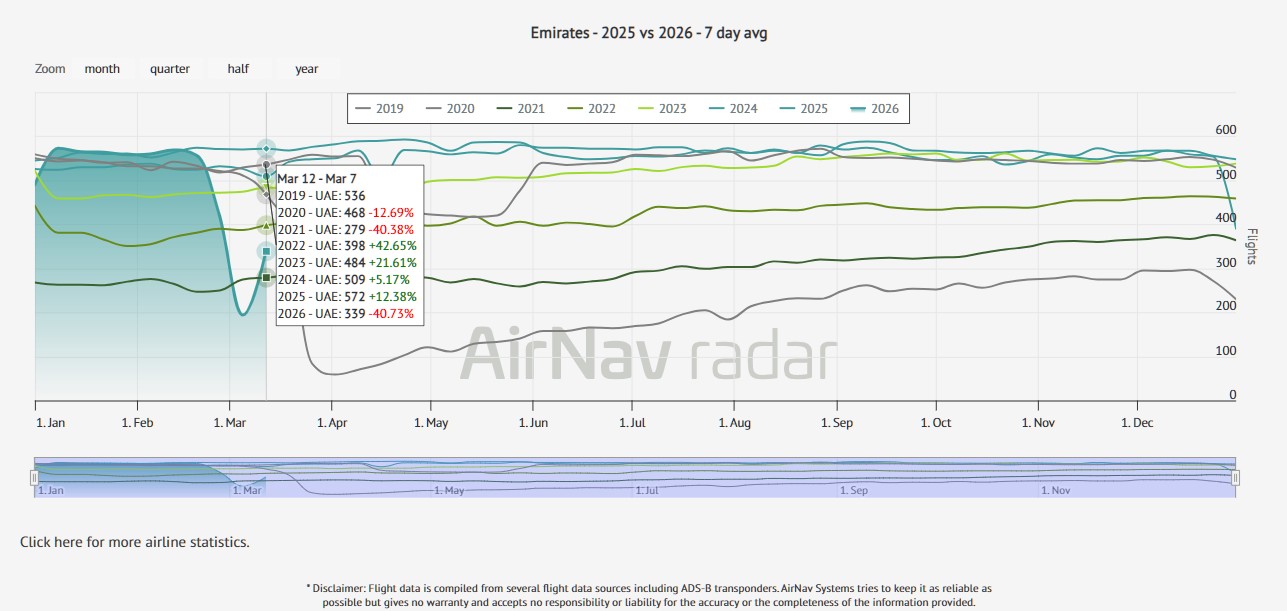
Operations at Emirates dropped sharply following the escalation and the imposition of regional airspace restrictions.
Typical activity for the airline averages around 550–600 flights per day.
During the disruption:
-
Mar 1–3: operations nearly halted
-
Mar 7: ~339 flights
-
Mar 12: ~456 flights
Even after partial recovery, this still represents a roughly 40–45% decline compared to normal operations.
For one of the world’s largest long-haul carriers, disruptions in Gulf airspace have immediate global ripple effects across international travel networks.
Etihad Airways
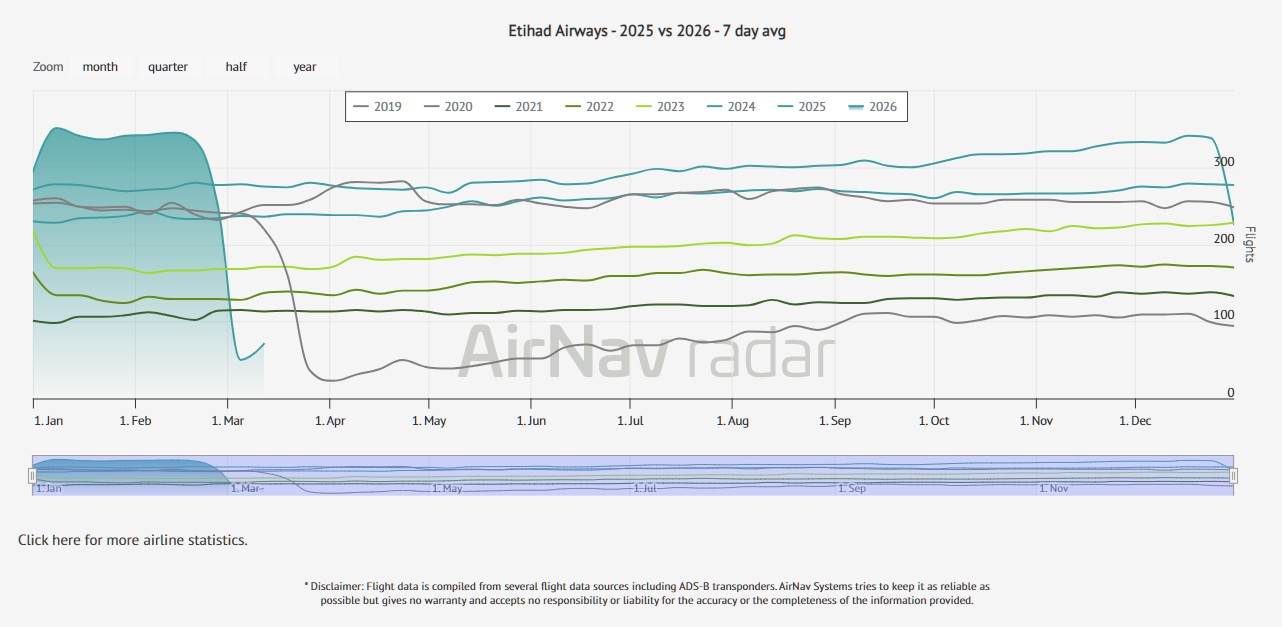
Operations at Etihad Airways also saw a dramatic decline.
The airline normally operates around 270–300 flights per day, but during the peak disruption:
-
Mar 7: ~71 flights
This represents a roughly 75% drop in activity, reflecting the significant impact of regional airspace restrictions.
Qatar Airways: A Network Shock
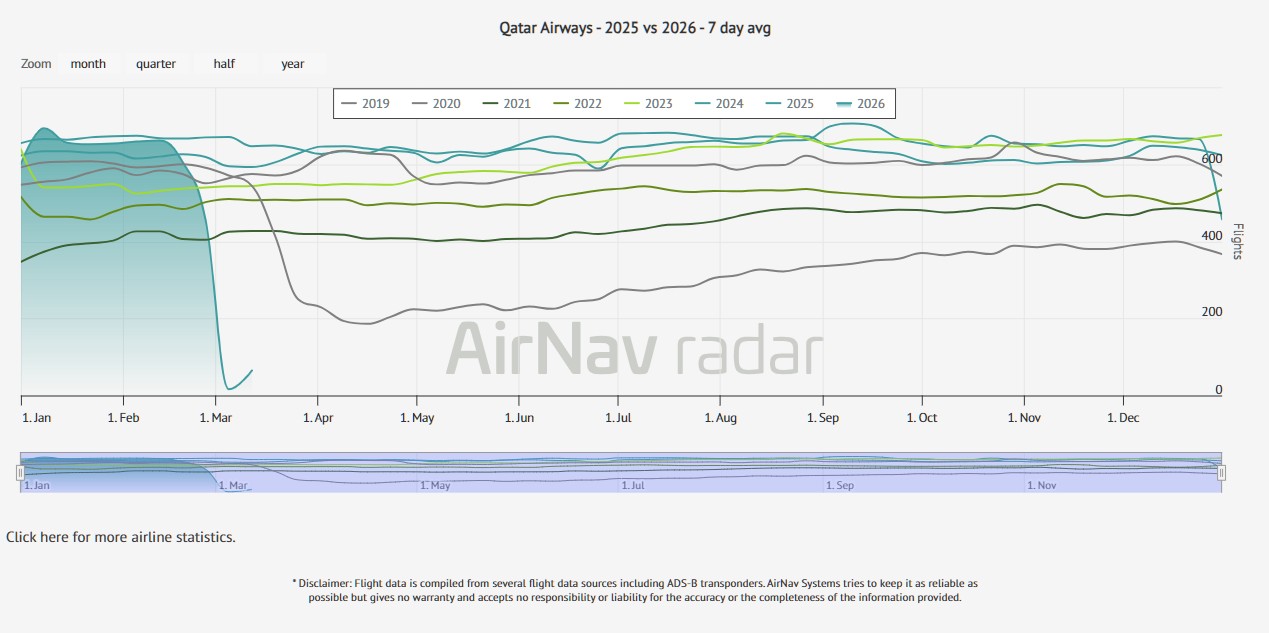
The operational disruption also heavily impacted Qatar Airways, whose global network is centered at Hamad International Airport.
Historical data shows how dramatic the change was when compared with normal operations.
Historical March averages
| Year | Average Flights |
|---|---|
| 2019 | ~575 |
| 2024 | ~647 |
| 2025 | ~593 |
However, March 2026 shows a dramatic collapse to roughly 65 flights, reflecting the severe operational disruption caused by the regional conflict and airspace restrictions.
For an airline that normally operates hundreds of flights per day from Doha, this represents a network-wide operational shock.
How to Find These Aviation Statistics
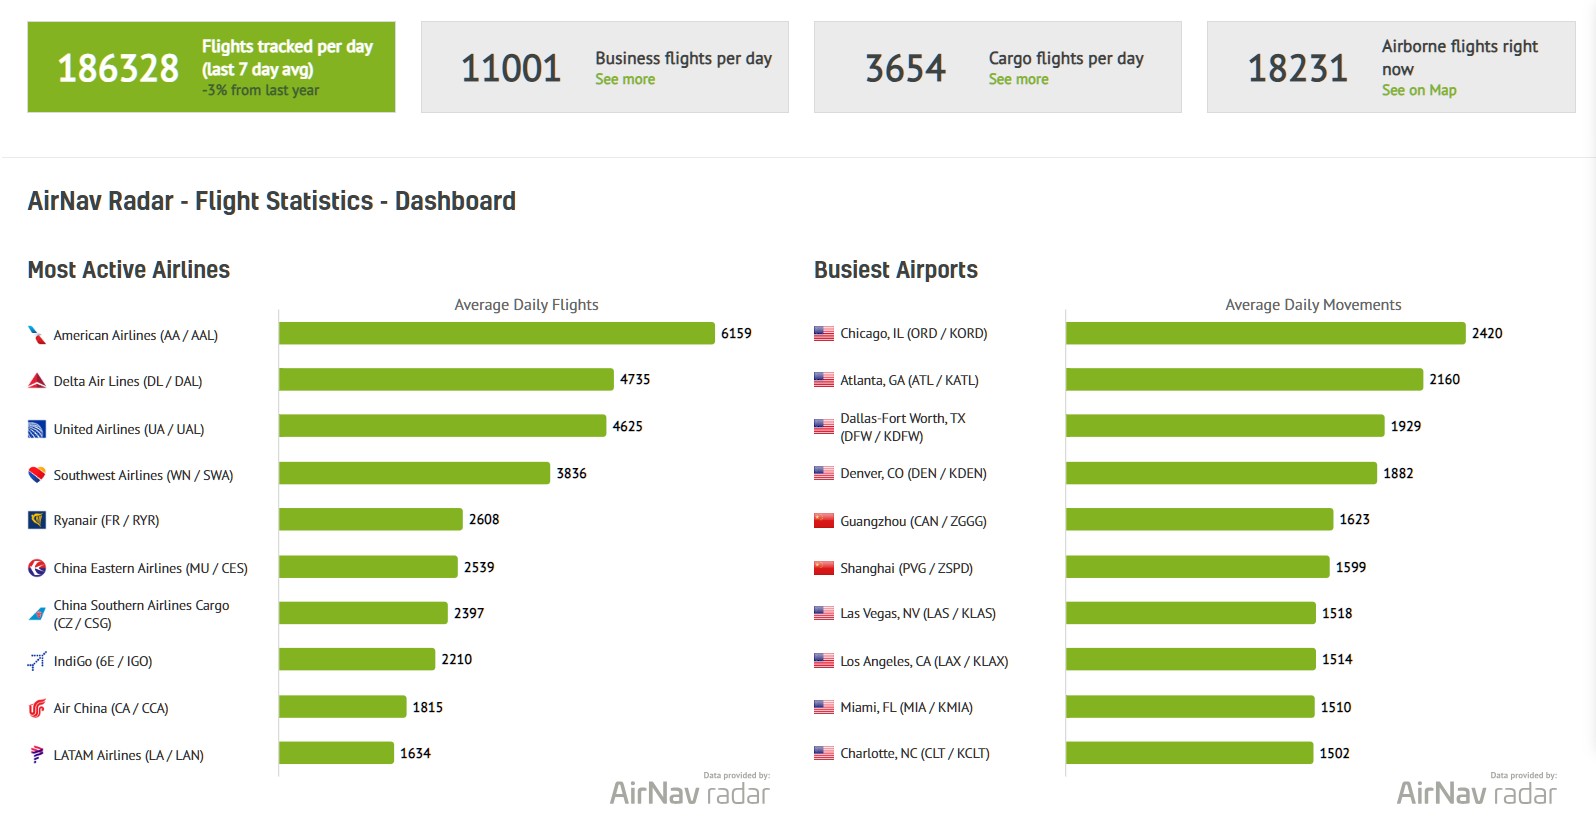
Readers can explore these datasets directly through the AirNav Radar Statistics portal, which provides detailed analytics for airports, airlines, and flight activity trends.
Step-by-step:
Visit the statistics page:
https://www.airnavradar.com/statistics
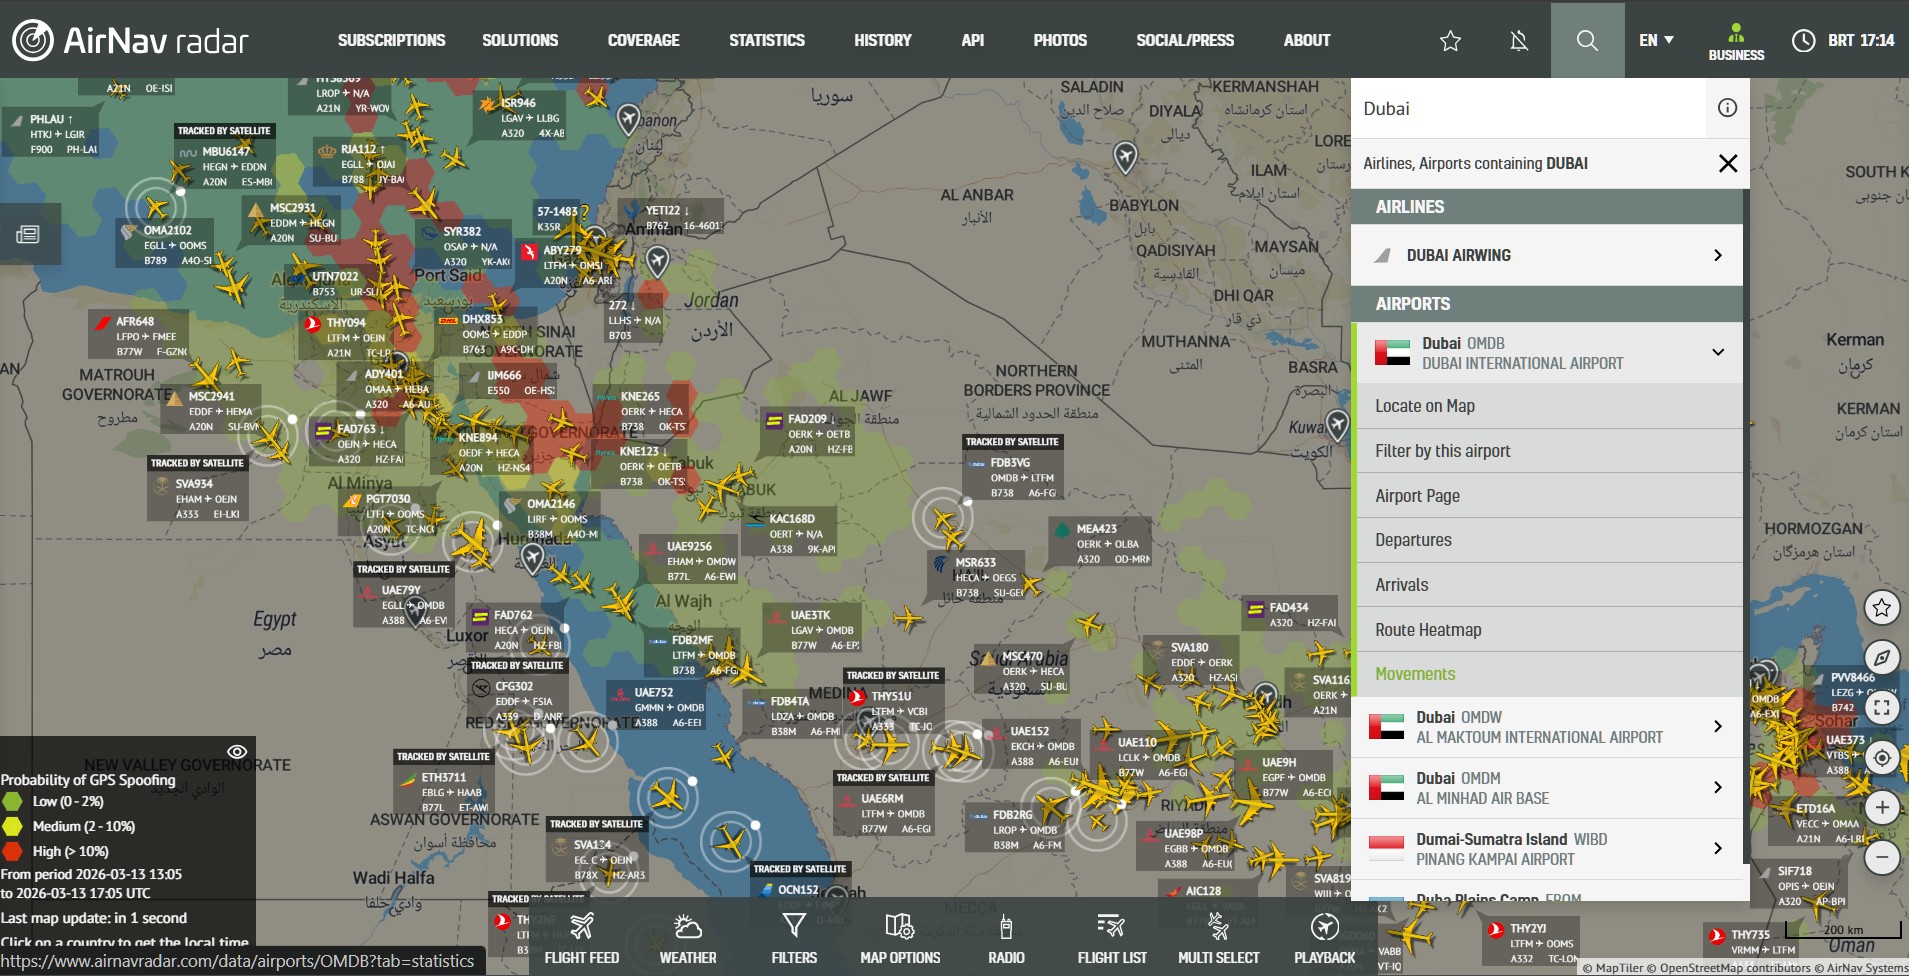
- Search for an airport name, ICAO code, or IATA code (for example: DXB, AUH, or DOH).
- Select “Flight Activity” to view detailed charts showing daily traffic levels over time.
- These graphs allow users to quickly identify trends, disruptions, and changes in airport operations.
Route Heat Maps: Visualizing the Most Flown Routes
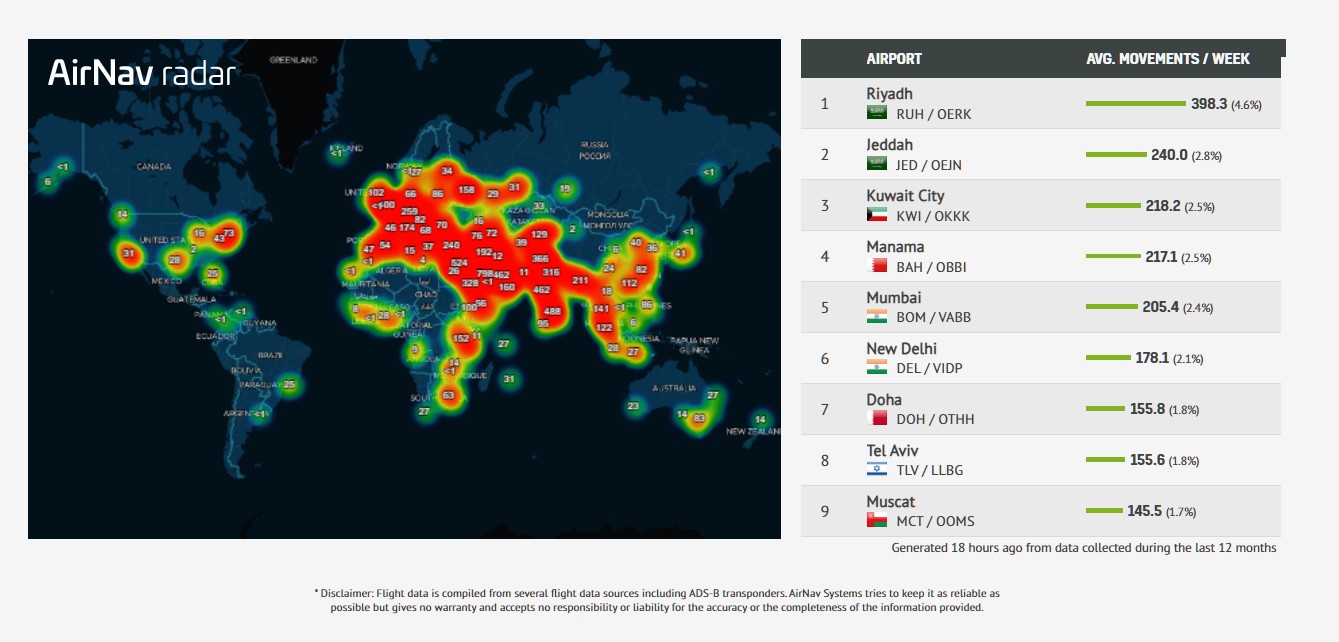
Another useful tool available on AirNav Radar is the route heat map. By selecting the Flight Activity section for an airport such as Dubai International Airport, users can also view a heat map of the most frequently flown routes over the past seven days.
These visualizations help illustrate:
-
the busiest city pairs
-
shifts in regional connectivity
-
How route networks evolve during operational disruptions
For major hubs like Dubai, Abu Dhabi, and Doha, route heat maps provide an additional layer of insight into how airlines adjust their networks in response to geopolitical events.